
Subhajit Dutta
DATA ANALYSTSQL | Power BI | Python | Excel | Machine Learning
Experienced Data Analyst with expertise in SQL, Power BI, Python, Excel, and Machine Learning. Leveraging analytics to drive impactful insights and solutions for industry success. An immediate joiner who can apply the learnings for the benefit of the company.
My Projects
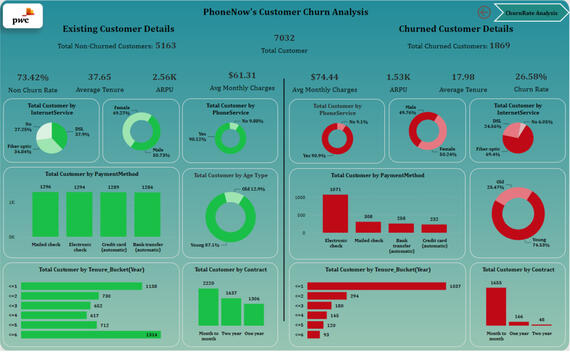
End-to-End Customer Churn Analysis Project
1. Cleaned and analyzed a company's dataset using Excel and Power BI to identify the reasons behind a high churn rate of 26.58% and provided recommendations for reducing churn and retaining customers.2. Defined relevant KPIs, created a user-friendly dashboard using Power BI to showcase the identified KPIs, communicated findings to business stakeholders, and developed a Churn Predictor Application utilizing various tools such as Python's NumPy, Pandas, Matplotlib, Seaborn, and Scikit-learn libraries, as well as machine learning, HTML, CSS, and Flask skills to reduce the risk of churn.
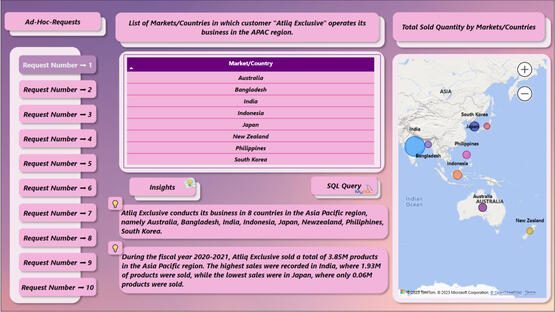
Consumer Goods Data Analysis & Visualization Project
1. Conducted data analysis on nearly 2 million records and provided actionable insights to management in the consumer goods domain by leveraging SQL and Power BI.2. Utilized SQL techniques such as Common Table Expressions (CTE), various types of joins (Inner Join, Left Join, Cross Join), Group By, Temporary Tables, Window Functions Over with Sum, Count, Dense Rank, Rank, etc. to compare the performance of the company with competitors, analyze product segments, compare sales between 2020 and 2021, and identify the highest and lowest cost products. Validated the results of SQL queries using Excel and created a video presentation to effectively communicate the analysis and insights to business stakeholders.
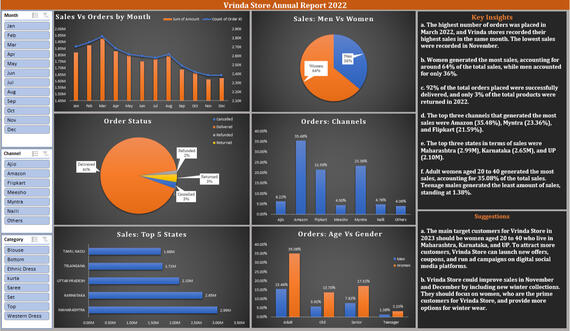
End-to-End Data Analytics Project using Excel
1. Cleaned the data by identifying and removing duplicate records and null values, addressing inconsistent data for gender and quantity columns, and using Excel functions and formulas to create new features for analysis, such as age buckets and month names from the date column.2. Conducted data analysis to identify key insights such as the highest sales in March 2022 and women generating the most sales. Developed interactive visualizations and a comprehensive report to communicate the findings effectively to the client and proposed actionable recommendations based on the analysis, including targeting women aged 20 to 40 in Maharashtra, Karnataka, and UP with new offers and coupons. Displayed strong communication and collaboration skills by sharing insights and suggestions with the client and working towards their goals of understanding their customers and growing their sales in 2023.
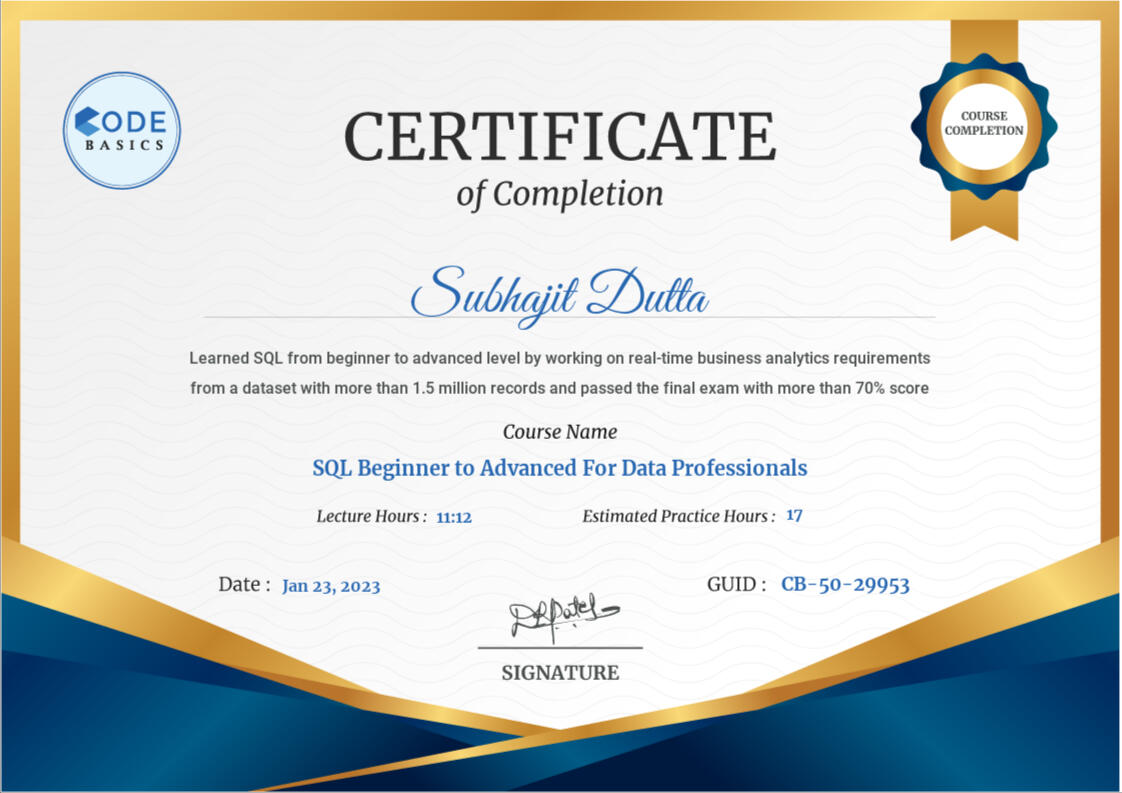
My Certificates

SQL

Power BI

Python

PwC Virtual Internship
Achievements

Secured 3rd Position in Resume Project Challenge organized by Codebasics
Thank You for Checking!!
Subhajit Dutta